The Challenge: Actionable Feedback
When we run lead generation campaigns, we look at a whole bunch of different metrics. However, a lot of times we don’t have a view on what happens after the lead is delivered to a salesperson.
Sometimes we hear:
“This month was bad. You need to change the campaign.”
Other times it’s the opposite:
“Sales are great! That new campaign must be working!”
Neither statement gives us actionable info to manage your ad spend. It’s not actionable because we don’t know if you have a good month because:
- You got great leads two months ago
- You hired a new salesperson who closes at a better rate
- We are in high season time.
The Solution: Proper ROAS Calculation
What we really need to know is ROAS (Return on Ad Spend) by month or week. The issue is that it can be challenging to do when it comes to lead generation compared to e-Commerce campaigns. Some of our clients just completely give up on this.
Caluclating ROAS properly will allow you to:
- Be confident in your marketing investment
- Confidently scale the budget when you know ROAS is good – printing money
- Separate Sales Performance vs. Marketing Campaign Impact
- Be able to provide actionable information to your marketing team, enabling them to make data-driven campaign adjustments.
This article will focus on the correct methods for calculating lead generation ROAS. We will provide examples of various companies and typical errors that we commonly encounter.
And if you’re reading this thinking, “My business is too small for ROAS,” the opposite is true. The smaller the business, the more vigilant you need to be about marketing performance — because you can’t afford wasted spend like bigger companies can. The good news is that with modern tools, even small businesses can track ROAS with the same precision as larger companies.
Key Takeways on Lead Generation ROAS
- Match revenue to when the lead was generated — not when the sale closes. Otherwise, your reporting will be misleading.
- Account for sales cycles — a garage door lead might close same-day, but movers or event companies can take weeks or months.
- Look beyond the first sale — initial ROAS may look poor, but lifetime value (LTV) often turns campaigns profitable.
- Separate lead quality from sales performance — lead scoring helps you see if ads delivered good leads, or if sales follow-up is the issue.
How Is ROAS Calculated?
Simple ROAS
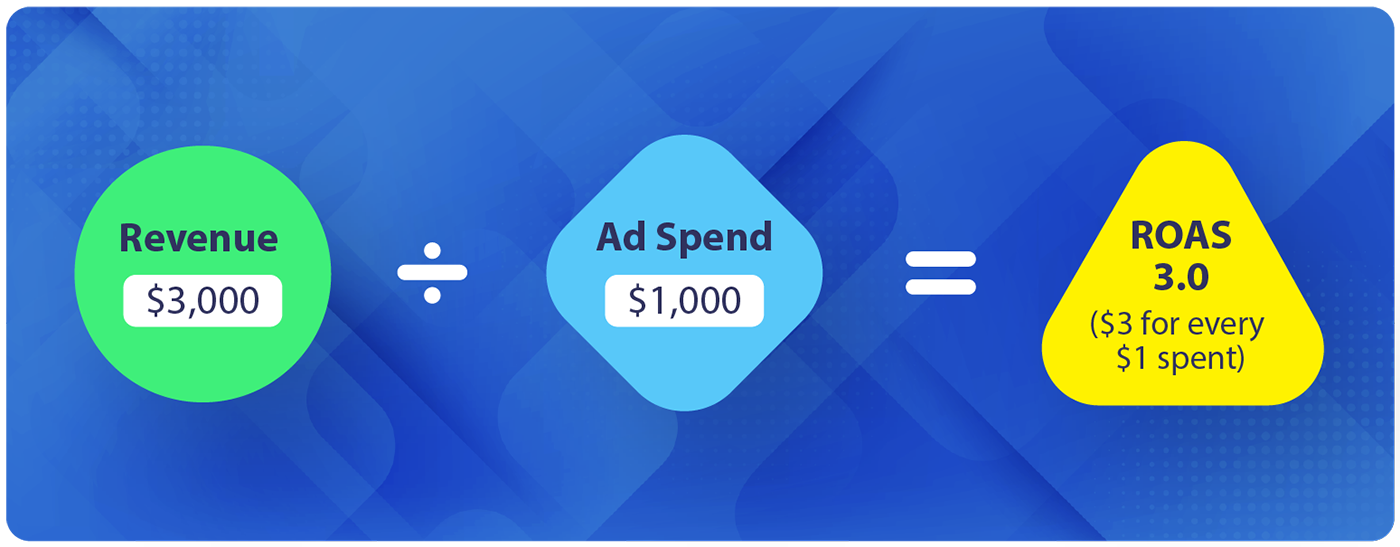
Revenue ÷ Ad Spend = ROAS
If you spend $1,000 on ads and bring in $3,000 in revenue, your ROAS is 3.0 (or “$3 for every $1 spent”).
Notice that the ROAS formula doesn’t account for the cost of goods sold. Meaning ROAS doesn’t equal ROI. Calculating it this way allows you to compare yourself against benchmarks and separate the issue of how good your margins are vs. how good your ad campaign is.
ROAS with Agency Fees
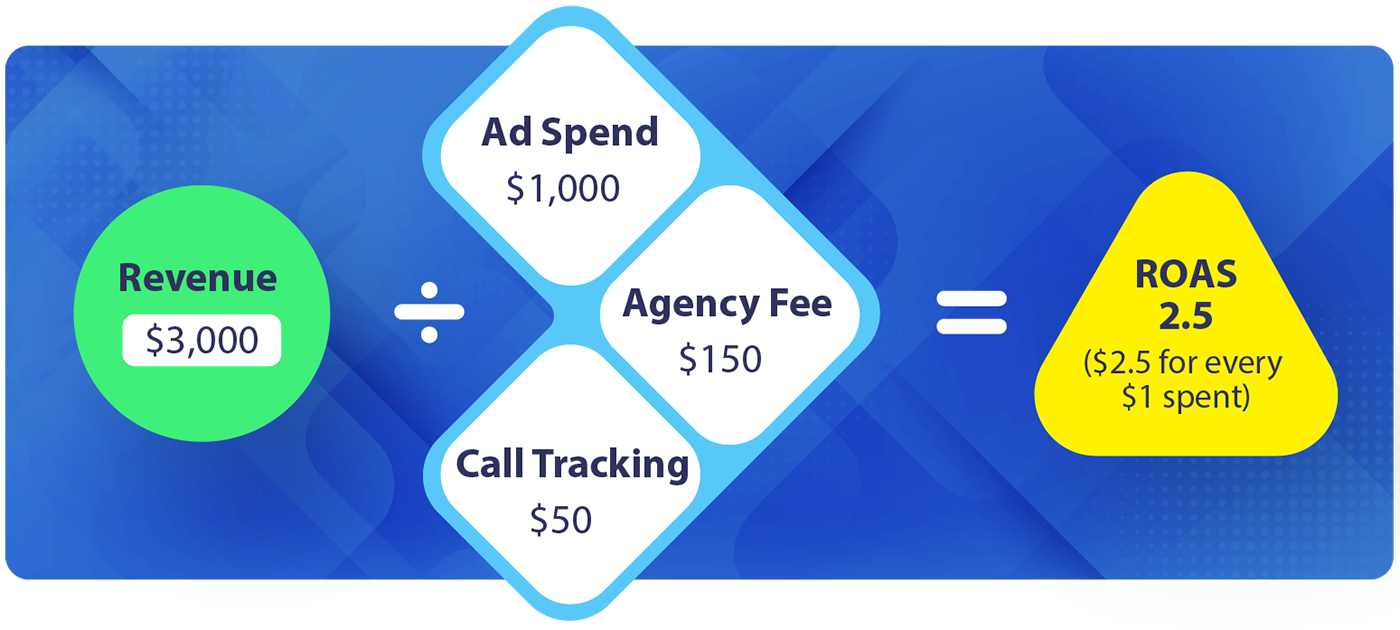
The only expense we suggest adding to ROAS is the total of all fees paid to the marketing agency, plus any incremental expenses. The proper example would be:
- Ad Spend: $1000
- Agency Fee: $150
- Call Tracking: $50
- Revenue: $3000
$3000 ÷ ($1000+$150+$50)=2.5X (or for $2.5 for every $1)
Why Is It So Hard to Calculate ROAS in Lead Generation?
When it comes to e-commerce, most modern systems, such as Shopify, automatically calculate ROAS and push the results back to the platforms. When it comes to Lead Generation, we face multiple challenges.
Time Lag
We are referring to the time lag between when the lead is received and when sales are made. The larger the lag, the more challenging it is to calculate the ROAS.
- No Lag | Garage Door Company: Leads often close the same day. Easy to measure short-term ROAS.
- 2-8 Week Lag | Moving Company: Customers typically book weeks in advance. Initial ROAS may appear weak initially, but it will improve later.
- 2-3 Month Lag | Event Company: Clients might book 3–4 months in advance. Early months can look like “no return” even when the pipeline is filling. In the initial period, it’s better to review the estimates in the pipeline.
Sales Person Performance vs. Bad Leads
Salespeople are human, and their performance can vary. The last thing you want to do is to adjust to a good-performing campaign because someone had a bad month.
Return/Referral Clients
Repeat customers are a double whammy for ROAS calculation. To accurately calculate ROAS, you must first determine your customer’s lifetime value (LTV). You may also consider repeat customers who click on your ads as a waste.
Ok, enough about the challenges, let’s look at what we need to do. You need to know that most of these issues can be quickly resolved by utilizing a modern CRM system like Hubspot or similar.
The Key Metrics You Need to Track
To calculate ROAS in lead generation, there are a few essential metrics you need to track.
1. Cost per Lead (CPL)
How much it costs to get one lead.
- Example:
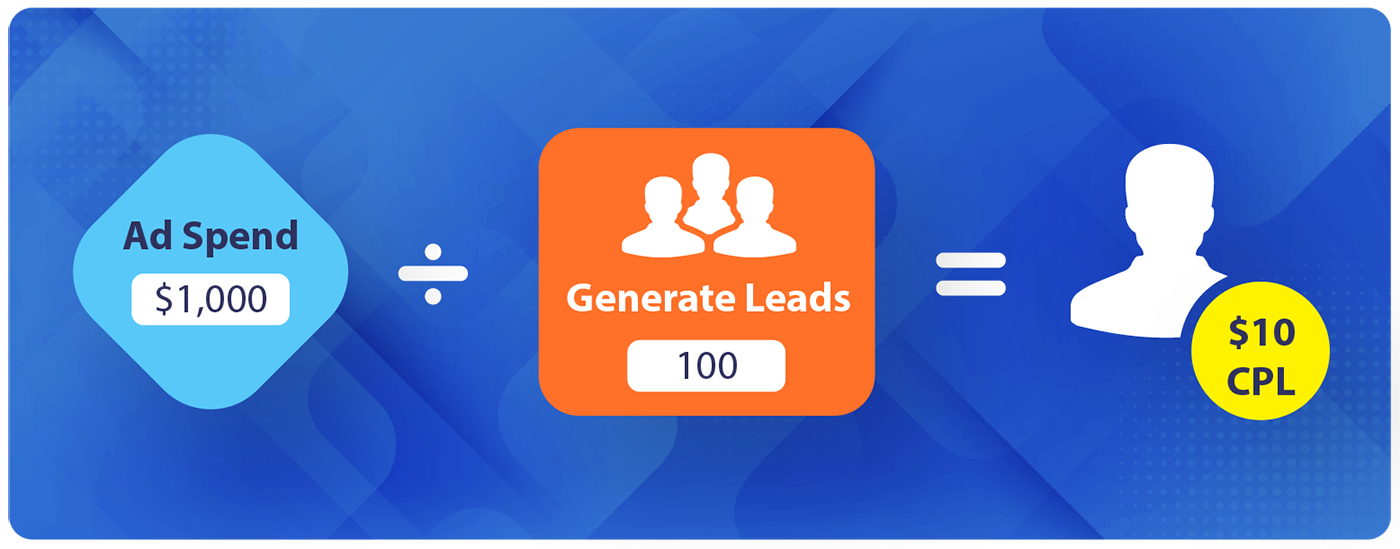
Spend $1,000, generate 100 leads (only count sales qualified leads) = $10 CPL.
2. Lead-to-Sale Conversion Rate
Not every lead becomes a customer. Tracking how many do is key.
- Example:
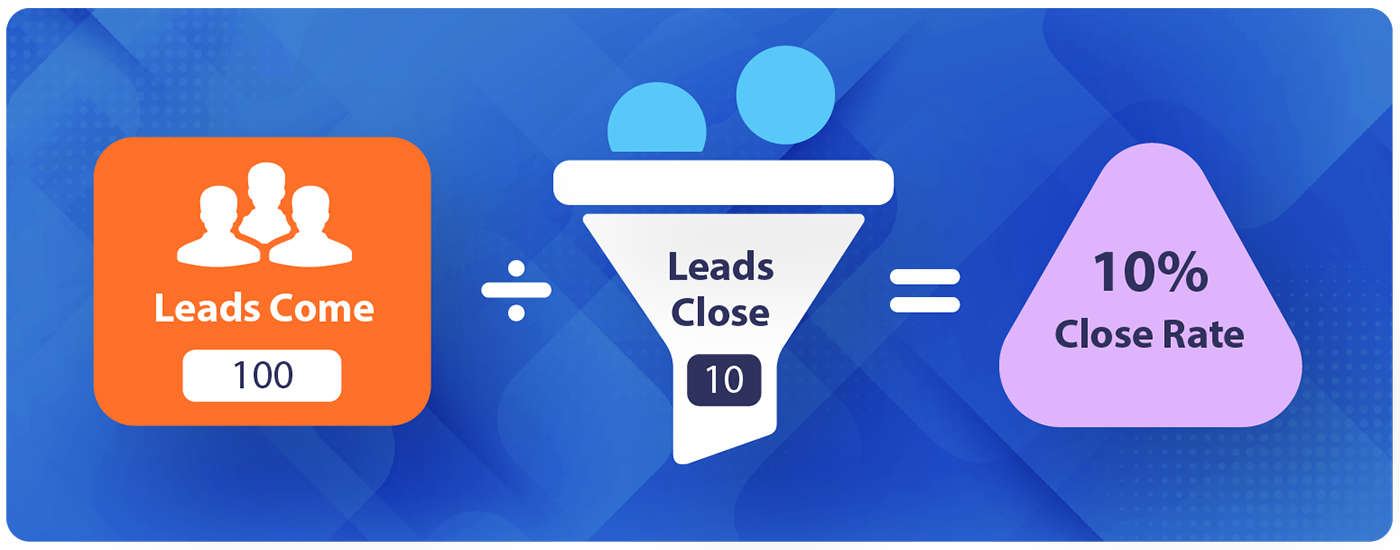
If 100 leads come in and 10 close, your close rate is 10%.
3. Average Order Value (AOV)
The average revenue per new customer.
4. Customer Lifetime Value (LTV)
Some customers buy once, others keep coming back. Knowing LTV is critical because the initial sale might not be profitable, but the relationship could be.
5. Time Lag Between Lead and Sale
This is where industry differences really show up. To calculate the real-time lag, we usually run a correlation analysis in a spreadsheet with a time delay. Once you see the closest one-to-one correlation, that is your average time lag.
6. Lead Scoring
This helps you separate lead quality from sales performance. If the leads score well (good fit, budget, interest), but sales are down, the issue likely sits with sales follow-up—not the ads.
Matching Revenue to Expenses (Correct Attribution)
Please, if you remember one thing from this article, it is this section. Most businesses use accrual accounting to calculate profit and loss. The returns on your investment are no different.
For example, an event company that gets a lead in January and books an event in March.
If you put that revenue under March spend, January looks unprofitable, and March looks amazing. But that’s misleading. The sale came from January’s lead. Proper attribution ties revenue back to the month the lead was created, not the close date.
I want to repeat this one more time, this is a fact: If you want to properly evaluate ROAS, you have to match revenues to the time the campaign ran.
Tracking money in and out, it’s still useful, but for cash flow purposes, rather than ROAS evaluation.
Practical ROAS Examples
Now that you know all of the metrics you need to know, let’s walk through different examples of how to calculate ROAS.
Garage Door Company ROAS
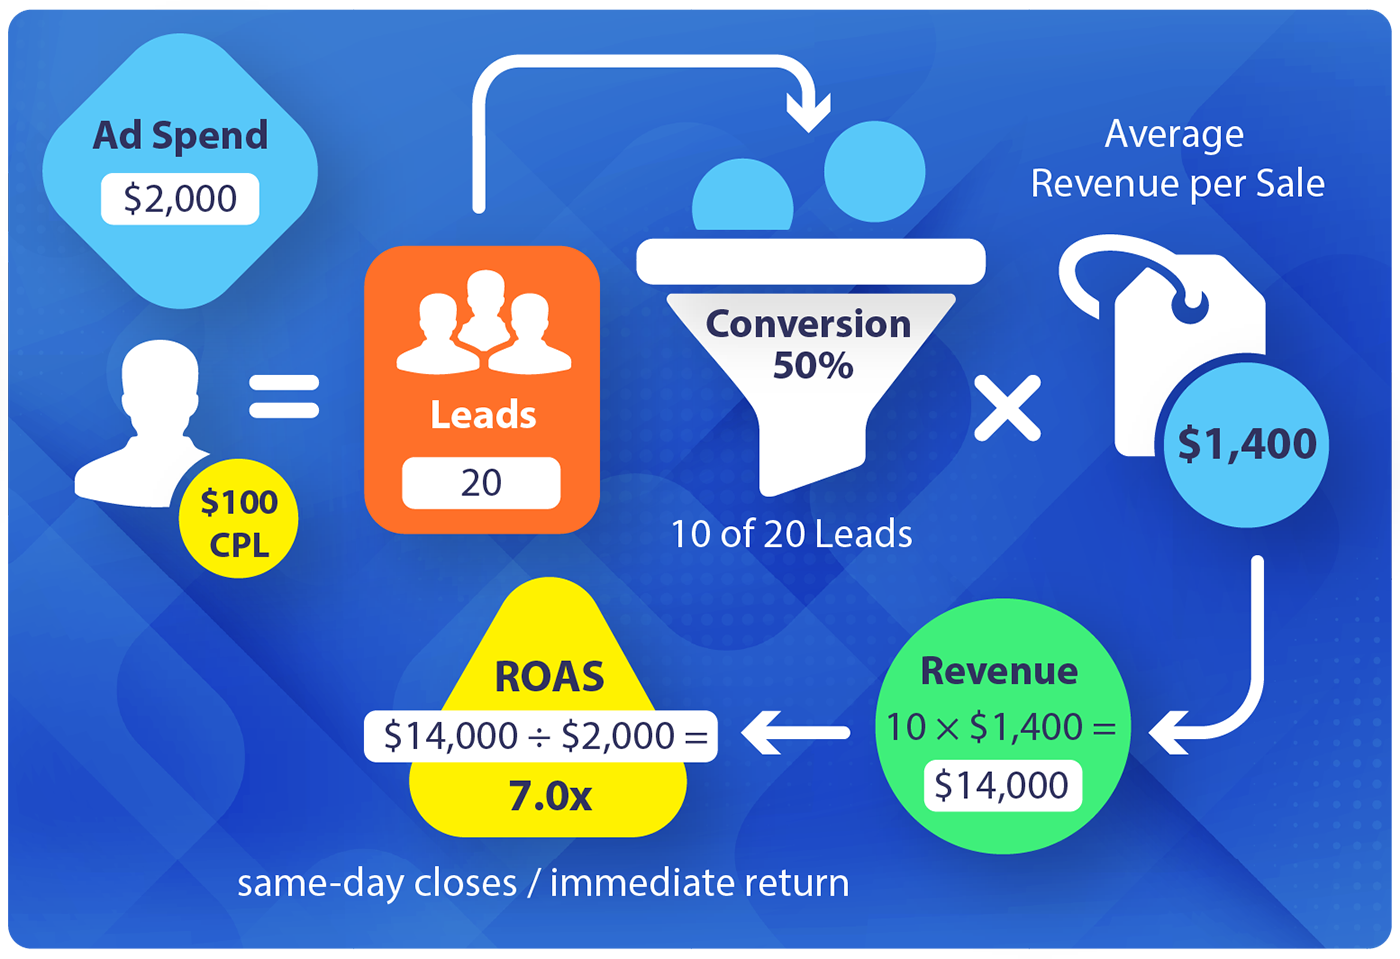
- Ad Spend: $2,000
- CPL: $100 → Leads: 20
- Lead→Sale Conversion: 50% (10 of 20)
- Average Revenue per Sale: $1,400
- Revenue: 10 × $1,400 = $14,000
- ROAS: $14,000÷$2000= 7.0× (same-day closes; immediate return)
Moving Company ROAS
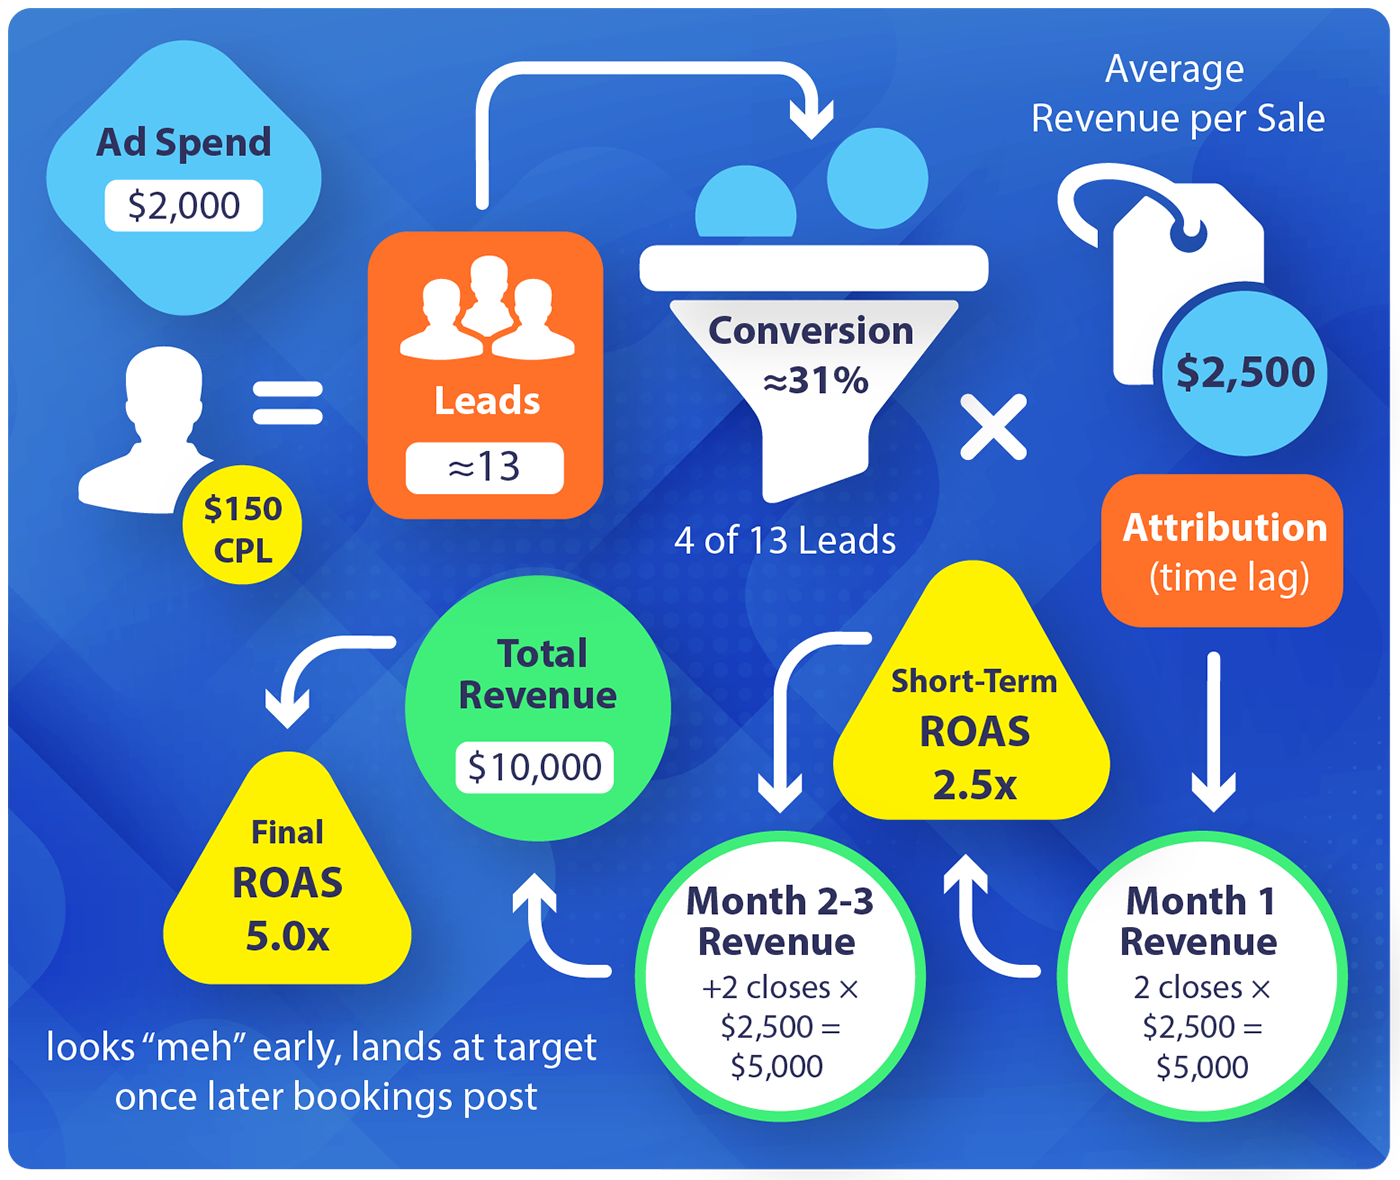
- Ad Spend: $2,000
- CPL: $150 → Leads: ≈13
- Lead→Sale Conversion: ≈31% (4 of 13)
- Average Revenue per Sale: $2,500
- Attribution (time lag)
- Month 1: 2 closes × $2,500 = $5,000 → Short-term ROAS: 5×
- Months 2-3: +2 closes × $2,500 = $5,000
- Total Revenue: $10,000
- Final ROAS: 5.0× (looks “meh” early, lands at target once later bookings post)
Event Company ROAS
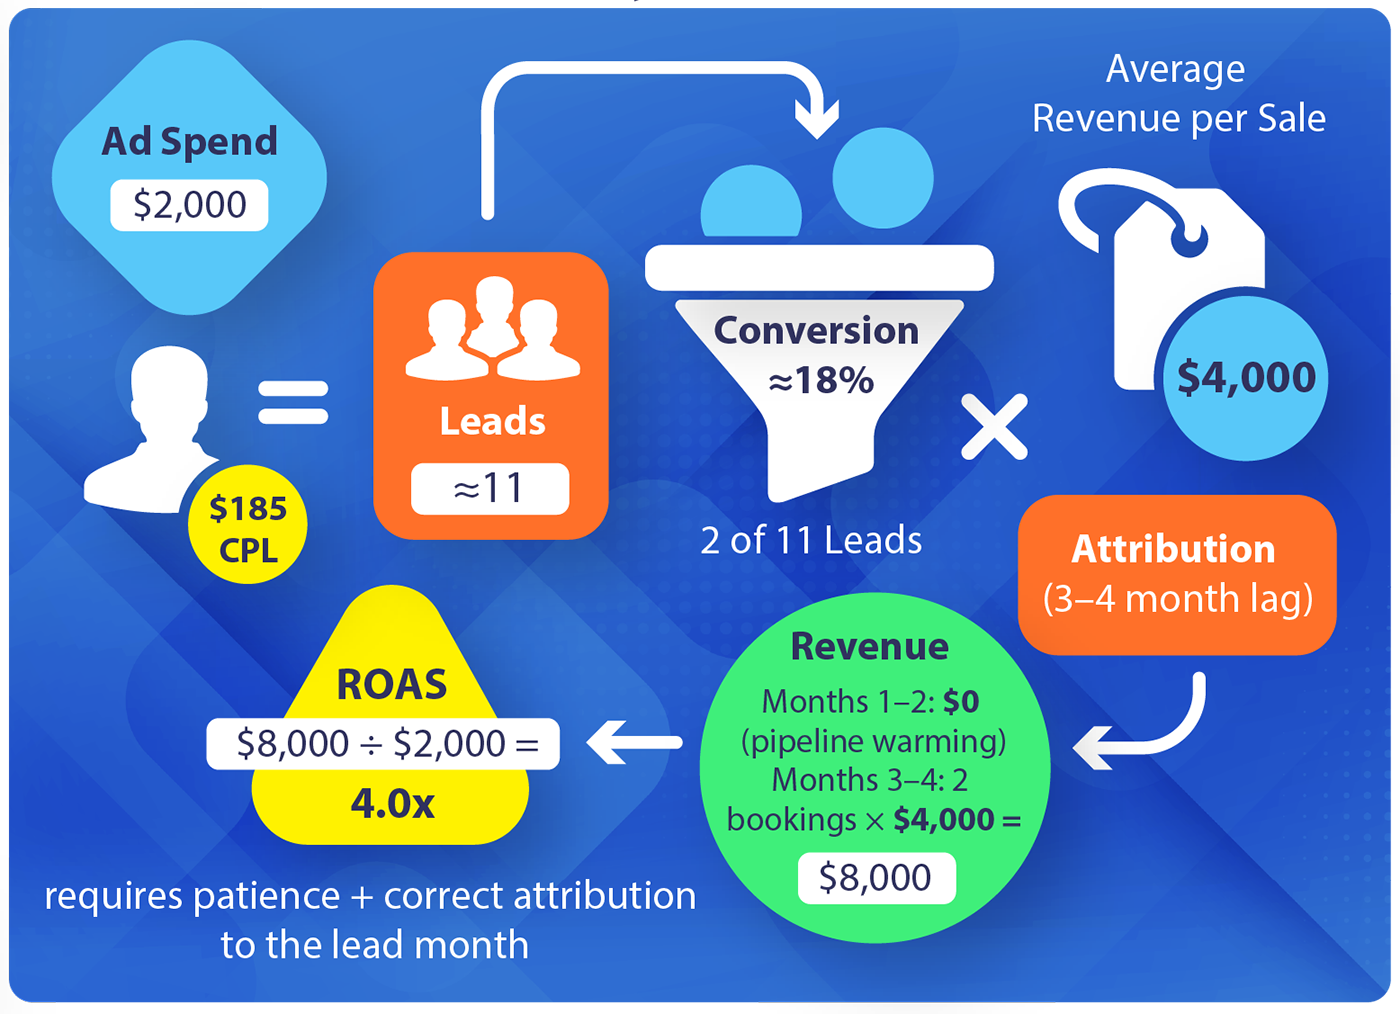
- Ad Spend: $2,000
- CPL: $185 → Leads: ≈11
- Lead→Sale Conversion: ≈18% (2 of 11)
- Average Revenue per Sale: $4,000
- Attribution (3-4 month lag):
- Months 1-2: $0 (pipeline warming)
- Months 3-4: 2 bookings × $4,000 = $8,000
- Final ROAS: 4.0× (requires patience + correct attribution to the lead month)
Plumbing Company ROAS
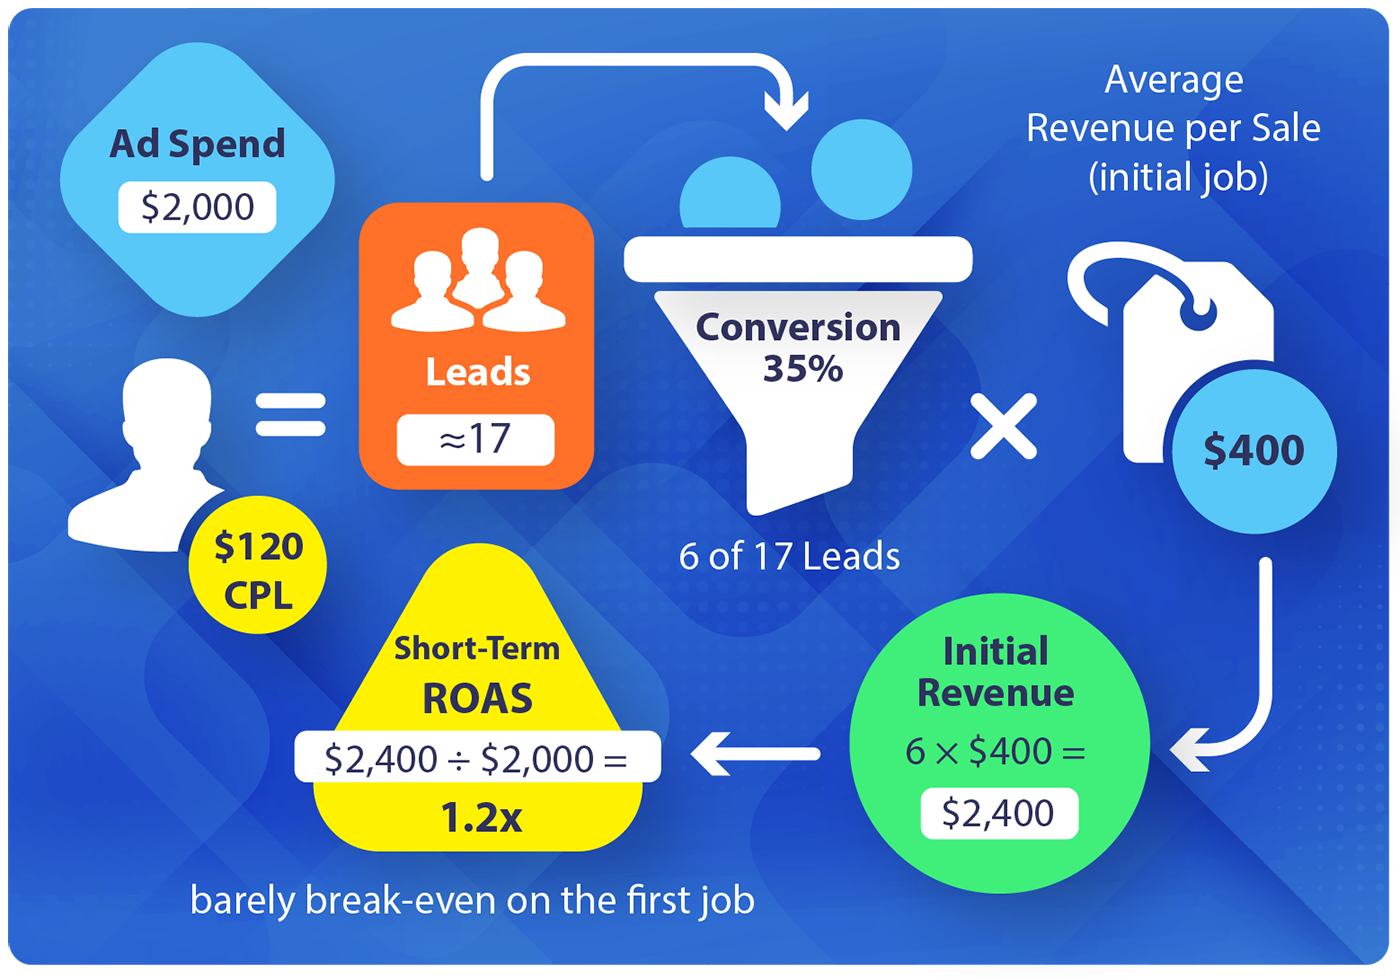
- Ad Spend: $2,000
- CPL: $120 → Leads: ≈17
- Lead→Sale Conversion: 35% (6 of 17)
- Average Revenue per Sale (initial job): $400
- Initial Revenue: 6 × $400 = $2,400
- Short-Term ROAS: 1.2× (barely break-even on the first job)
But here’s where plumbers are different:

- Customers often call the same plumber again for future jobs (repairs, upgrades, emergencies).
- They also refer friends and family when they trust the service.
- If each new customer averages 2 more jobs over 2 years, the total LTV per customer is ~$1,200.
- Total LTV Revenue: 6 × $1,200 = $7,200
- True ROAS (with LTV): 3.6×
Why this matters: ROAS depends on lead costs, close rates, AOV/LTV, and time lag. Tie revenue back to the lead’s month, not the close date, so you don’t pause campaigns that are actually profitable over the full sales cycle.
A Note on Sales Qualified Leads (SQLs) and the Need for Lead Scoring
For simplicity, the examples above assume that every lead is a Sales Qualified Lead (SQL) — meaning the person who inquired is a good fit for the service and has genuine purchase intent.
In the real world, not every lead is equal. Some people fill out a form just looking for a price. Others may be outside your service area or not ready to buy. That’s why lead scoring is critical.
Lead scoring provides a quantifiable measure of lead quality, instead of relying on a salesperson’s gut feeling. By assigning points based on budget, urgency, location, or fit, you can separate strong prospects from weak ones.
This distinction also helps separate marketing performance from sales performance. If marketing delivers a high number of well-scored leads but close rates are low, the issue lies with sales execution. If only a small percentage of leads meet the scoring threshold, the problem is in targeting and ad quality.
Common Mistakes Businesses Make When Calculating ROAS
- Wrong attribution: Counting revenue when it closes instead of when the lead was generated.
- Ignoring sales cycles: Overlooking the time lag between lead and sale.
- Over-focusing on CPL: Judging campaigns only on cost per lead without considering close rate or revenue.
- Misplaced blame: Assuming marketing is at fault when sales team performance is the real issue.
- No LTV view: Forgetting to factor in lifetime value and referrals.
- No lead scoring: Failing to separate Sales Qualified Leads (SQLs) from total leads, making it impossible to see if targeting or sales execution is the problem.
- Short-term thinking: Pausing campaigns too early before the sales cycle has had time to play out.
- Hidden costs: Not including agency fees or other incremental costs.
How to Track ROAS in Practice
Calculating ROAS the right way doesn’t require complicated software. What it does require is consistency. At a minimum, you need a system that ties every lead to ad spend and then connects that lead to eventual revenue.
Set Up a CRM or Tracking System
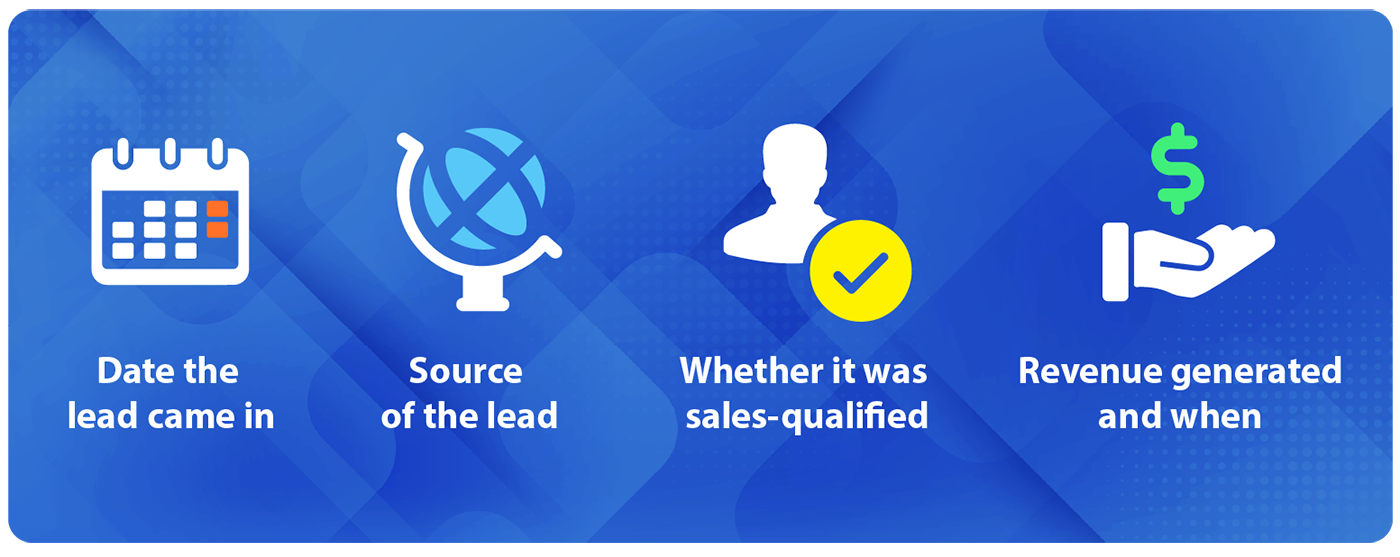
Tools like HubSpot, PipeDrive, or Salesforce make this easier. Even a well-structured spreadsheet can work for smaller businesses. The key is to log:
- Date the lead came in
- Source of the lead (Google Ads, Meta, etc.)
- Whether it was sales qualified
- Revenue generated, and when.
Link Ad Spend to Your Revenue Timeline
Pull data from ad platforms (Google Ads, Meta) and match it against your CRM. Revenue from a sale should always be tied back to the date the lead was generated.
Connect Marketing and Sales Teams
Marketing is responsible for lead quality. Sales is responsible for closing. When both teams share data — including lead scoring and conversion results — you get a full picture of where performance is strong and where it needs improvement.
The goal is to remove guesswork. When ad spend, leads, and revenue are connected in one place, ROAS becomes a clear, trackable number instead of a debate.
Wrapping It Up: What to Do Next
ROAS in lead generation is more complex than e-commerce, but it’s not impossible. The key is knowing what to measure and how to attribute results.
- Attribute revenue to the month the lead was generated, not the month the sale closed.
- Account for time lag — some industries see results same-day, others take months.
- Factor in lifetime value and referrals, not just the first sale.
- Use lead scoring to separate marketing quality from sales execution.
- Don’t judge campaigns too early; let the sales cycle play out.
Once you have this system in place, you can finally make decisions with confidence. You’ll know whether a campaign is worth scaling, adjusting, or pausing — not because of a “good” or “bad” month, but because the numbers prove it.
If you want help building a clear attribution system and improving your ROAS please contact us today.


